Observability for Agentic Systems
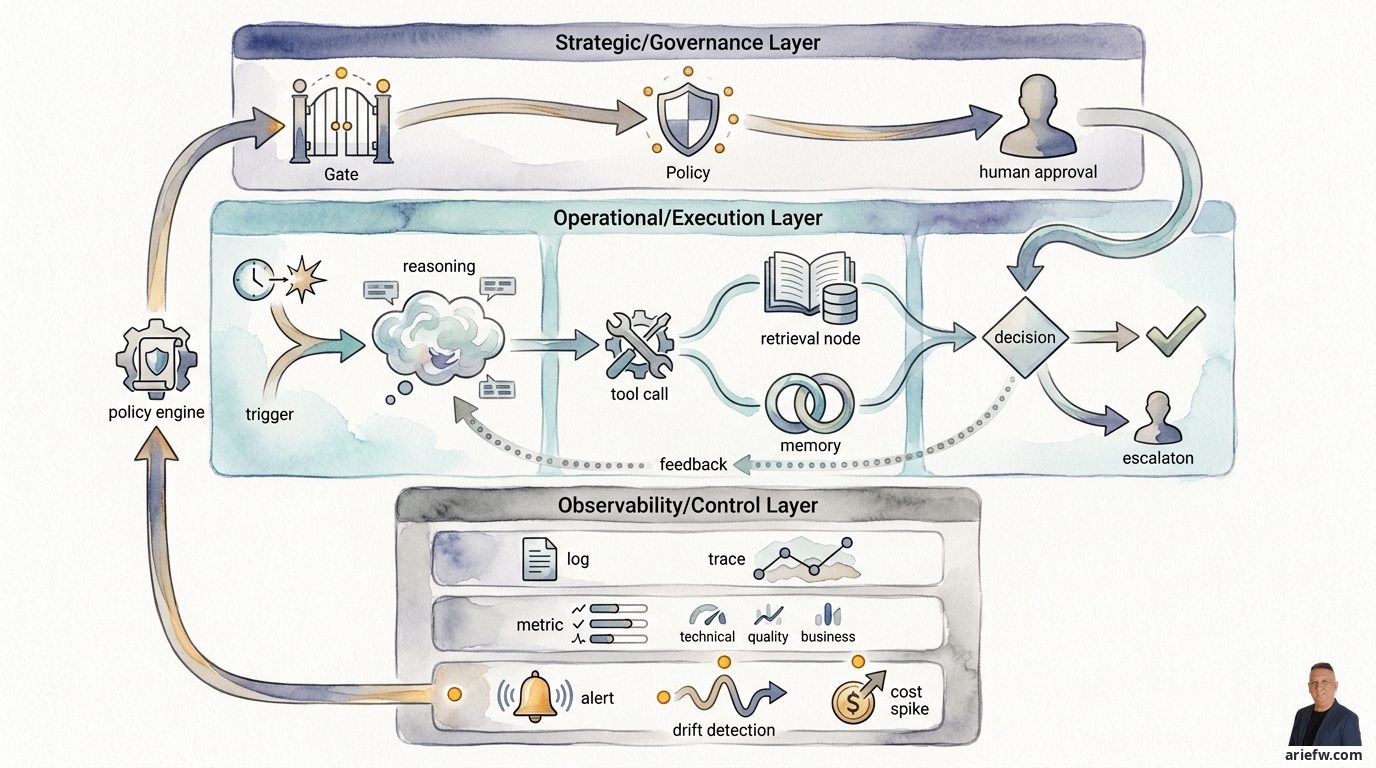
Imagine a finance team that has just deployed an agent to assist with the month-end close process. This agent can pull data from the ERP, read spreadsheets sent via email, and draft commentary for each account. On the surface, everything runs smoothly. No errors, no crashes, no API timeouts. But after a few cycles, the controller starts noticing anomalies: some account commentaries use figures from an outdated version of the data. The agent didn't call the wrong tool, it didn't fail technically, but its decision was operationally incorrect.
This kind of situation is a real problem. Once agents enter production, the questions shift from "is the system running?" to "what did the agent actually do, why did it do it, was the outcome good, and when should it be stopped?" Without the ability to answer these questions, a company lacks accountability. And without accountability, bounded autonomy can quickly turn into uncontrolled risk.
In traditional enterprise applications, observability typically focuses on technical health: is the service alive, is latency going up or down, are errors increasing, is the database slow, or is an API failing. For agentic systems, this is only a small part of the picture. An agent doesn't just execute deterministic code. It reasons, selects tools, gathers context, calls systems, stores or uses memory, and produces probabilistic outputs. Two executions with similar inputs can result in different decision paths. Therefore, observability for agentic systems must address three layers simultaneously: what happened technically, what the agent decided, and what the impact was on business outcomes and policy compliance.
Why Observability for Agentic Systems Is Far More Difficult
The main difficulty with observability in agentic systems isn't that the technology is newer, but that the object being observed is more complex. In a standard application, the execution flow is relatively clear. A request comes in, a service processes it, a database is read, a response goes out. If there's a problem, teams can trace logs, metrics, and traces to find the bottleneck or error. In agentic systems, the flow can be much more layered: a trigger comes from a user, event, or workflow; an orchestrator breaks down the task; the agent retrieves context from RAG or memory; the model generates reasoning or a plan; tools are called one by one; a policy engine evaluates actions; a human might be asked for approval; then the agent executes the action or escalates.
The problem is that failure doesn't always appear as a technical error. An agent might successfully call all APIs but choose the wrong action. It might not crash but use outdated context. It might pass technical checks but violate a policy. It might complete a task, but the quality of its decision is poor. Or it might produce an output that sounds convincing but is operationally wrong. In other words, agentic observability isn't sufficient if it only answers "is the system running?" It must also answer "is the agent acting correctly?"
The probabilistic nature of agentic systems changes how we monitor. Even when prompts, tools, and data appear identical, outputs can vary slightly. This means companies cannot rely solely on error-code-based monitoring. They need to monitor behavioral patterns. For example, in customer operations: a refund agent might never fail technically, but over the past week it has started escalating cases that it previously handled automatically. From an infrastructure perspective, everything is green. From an operations perspective, there's a behavioral drift that is reducing productivity. Another example in procurement: an intake-to-PO agent might still successfully create requests, but it has started more frequently choosing a more conservative approval path because the retrieval policy changed. There's no technical incident, but cycle time is worsening.
In an enterprise context, observability isn't just an IT operations tool. It is a governance mechanism. Risk, audit, compliance, and process owners need to be able to answer: what context did the agent use, what tools were called, what policies were applied, when did the agent stop and ask for approval, who corrected the output, and how did that decision affect the business transaction or case? If a company cannot reconstruct this chain, there is no solid foundation for incident investigation, audits, quality evaluation, model improvement, or increasing levels of autonomy. This is why observability must be treated as part of the control plane, not just an operational dashboard.
What Must Be Logged: From Prompt to Outcome
The most common mistake is assuming that logging the prompt and response is sufficient for an agent. For the enterprise, this is far too shallow. Proper logging for agentic systems must capture the end-to-end decision trail. Not just what the model said, but the context, actions, and controls surrounding it.
There are six minimum log components to consider. First, the trigger and initial context. The company needs to know how the workflow started: was it triggered by a user, a system event, a scheduled job, or a handoff from another agent? This log must record the originating principal's identity, time, channel, and relevant business object, such as an invoice number, ticket ID, order ID, or incident ID.
Second, the prompt and runtime instructions. This isn't about storing every detail indiscriminately, but ensuring the company can understand which system instructions were active, what parameters were used, which version of the prompt or workflow was running, and what model configuration was employed. This is crucial when comparing agent performance across versions or investigating behavioral changes.
Third, the retrieved context. If the agent uses RAG, a knowledge graph, or memory, the log must show which documents or context snippets were retrieved, from which source, their version or timestamp, and whether the access passed permission checks. Without this, it's difficult to explain why the agent made a particular decision.
Fourth, the model response and reasoning artifacts. The company doesn't always need to store the entire raw chain-of-thought. But it does need to store enough artifacts for audit and debugging, such as a summary of the action plan, intent classification, confidence signals if available, or the structured decision output used for the next step. The principle: store enough for accountability, but don't turn the log into a leak for sensitive data or model intellectual property.
Fifth, the tool calls and their results. Every tool call must be recorded: which tool was called, its key parameters, whether the result was a success or failure, the latency, whether there were retries, and what state changes occurred in the target system. For workflows like finance close, IT operations, or procurement, this is the most critical part because this is where the agent begins to affect operational reality.
Sixth, policy decisions, human approvals, and the final action. If there is a policy engine, approval workflow, or guardrails, all of this must be logged: which policy was evaluated, the result (allow, deny, escalate, or require approval), who the human approver was, what the final decision was, and what final action was actually executed. Without this layer, the company only has a technical log, not a governance log.
Good logs don't necessarily produce good traces. Many organizations have logs in many places but cannot stitch together the flow from start to finish. For agentic systems, a trace must show the complete journey: the incoming trigger, the active agent or orchestrator, the context retrieved, the reasoning or planning steps, the tool calls made, the policy checks, any human approval, the final action, and the business outcome. For example, in AP exception handling: an invoice mismatch comes in, the agent retrieves PO data, goods receipt, and vendor history, the agent classifies the cause of the mismatch, the agent calls a tool to open a case, the policy engine checks if the case can be auto-routed, a supervisor approves for certain cases, the agent sends a follow-up to the buyer, and the case is closed or remains open. If this trace is incomplete, the operations team only sees fragments of events without understanding cause and effect.
The more complete the log, the greater the risk of data exposure. This is a trade-off that must be managed with discipline. Agentic systems often touch customer data, payroll information, vendor details, contracts, financial data, or internal incident records. Therefore, logging must be designed with principles for redacting sensitive data that doesn't need to be stored raw, tokenizing or masking certain identifiers, using secure storage with strict access controls, having clear retention policies, and ensuring segregation of duties so that not everyone managing observability can see sensitive content. For example, in HR operations: logs may record that the agent retrieved leave policy and onboarding status, but not all personal details need to be stored raw on a public dashboard. In customer service: transcripts may need to be stored for limited audit purposes, but PII must be masked for day-to-day operational use. The key principle: auditability must increase without enlarging the data blast radius.
Runtime Metrics: Not Just Technical, But Also Quality and Business
Once logging and tracing are in place, the next step is defining metrics. This is where many agentic implementations are still too narrow. They only monitor latency and error rate, and then feel the system is "observable." Yet agentic systems require three distinct groups of metrics.
The first group is technical metrics for maintaining runtime health. Technical metrics remain important because agentic systems depend on models, APIs, retrieval, and tool integrations, all of which can fail. Some basic metrics to monitor include: latency per step and end-to-end, token or compute cost per transaction, tool error rate, retry rate, timeout rate, fallback usage, failure mode distribution, and the availability of critical components like the model gateway, vector store, policy engine, or tool registry. For example, in IT operations: if the latency of an incident triage agent spikes, incident handling SLAs could be compromised. In customer operations: if the retry rate to the CRM API increases, the agent might start failing to properly assemble the customer context. Technical metrics help the platform team maintain stability, but they are not sufficient to assess whether the agent is still trustworthy.
The second group is quality metrics to assess whether the agent is making good decisions. This is the layer that distinguishes agentic observability from standard application observability. Quality metrics can include: accuracy against expected labels or outcomes, hallucination rate or unsupported answer rate, escalation rate, policy violation rate, human correction rate, rework rate after an agent action, tool selection accuracy, and grounding quality against the retrieved context. For example, in finance close: how many agent draft commentaries had to be corrected by the controller, how many exceptions were misclassified, and how often did the agent retrieve irrelevant accounting guidance. In procurement: how many requests were routed to the wrong approval path, how many vendor recommendations were rejected by the buyer, and how often was a policy breach prevented or slipped through. In customer operations: how many refund recommendations were canceled by a supervisor, how many agent answers were not supported by customer entitlements, and how many cases had to be reopened. An important trade-off here: some quality metrics cannot be fully automated. Companies often need a combination of automated evaluation, manual sampling, user feedback, and domain expert review.
The third group is business metrics to assess whether the agent is genuinely improving operations. Ultimately, agentic systems are built not to produce beautiful traces, but to improve business outcomes. Therefore, observability must connect to metrics like cycle time, cost per transaction, resolution rate, touchless rate, backlog reduction, revenue impact if relevant, working capital impact for specific use cases, and customer or employee satisfaction. For example, in shared services: an agent for case management might look technically healthy, but if the cost per case isn't decreasing and the backlog isn't improving, the design needs to be revisited. In GCC finance operations: an AP exception agent might have high accuracy, but if cycle time isn't improving because the approval bottleneck remains, the problem lies in the operating model, not the AI model alone.
One important discipline is separating technical, quality, and business metrics. If they are all mixed together, the organization will struggle to read the root cause of a problem. For instance: increased latency is a technical issue, a rising human correction rate is a quality issue, and a stagnant cycle time is a business or process design issue. The three are interconnected, but they should not be treated as the same thing.
Monitoring and Alerting: Detecting Drift Before It Becomes an Incident
Once metrics are defined, the company needs to decide what to monitor continuously and when an alert should fire. This is more difficult in agentic systems because many problems manifest as shifts in patterns, not total failures.
There are several things that should be actively monitored. First, behavioral drift. An agent's behavior can change even without major application changes. Causes can include model changes, prompt changes, changes to the retrieval corpus, shifts in data distribution, or changes in tool responses. Signals can include a rising escalation rate, outputs becoming unusually longer or shorter, a specific tool being used far more frequently, or a sharp change in classification distribution.
Second, tool usage anomalies. If a procurement agent that usually calls contract and vendor APIs suddenly starts calling the manual exception path more often, that's an important signal. If an IT operations agent starts executing a particular runbook far more frequently than its baseline, it could indicate drift, a bug, or an environmental change.
Third, changes in output distribution. Monitoring needs to look at output patterns, not just errors. For example: more "I don't know" answers, more conservative recommendations, more actions being canceled by humans, or more cases ending without resolution. These are often early signs that agent quality is declining.
Not all alerts should be treated as technical incidents. For agentic systems, there are at least four alert categories. First, technical incidents, such as a model gateway being down, a tool API timing out, a vector store failing, latency exceeding a threshold, or a spike in retry rate. The primary owner is usually the platform or engineering team. Second, policy breaches, such as an agent attempting an action outside its permissions, accessing sensitive data out of context, bypassing a mandatory approval, or having a tool call repeatedly denied due to a policy mismatch. The owners involve security, risk, and the process owner. Third, low quality, such as a sharp increase in human correction rate, a rise in unsupported answers, a spike in misclassifications, or a drastic change in escalation rate. This typically requires a joint review between the product team, domain owner, and AI ops. Fourth, cost spikes, such as an increase in token cost per transaction, too many repeated tool calls, overly large context retrieval, or increased fallback to an expensive model. This is important because agentic systems can appear to be "working" while their economics silently deteriorate.
To make this more concrete, imagine a dashboard for a procurement intake-to-PO agent. A useful dashboard wouldn't just display uptime. It would ideally have four panels. Panel one, runtime health: request volume per hour/day, end-to-end latency, tool success/failure rate, retry rate, token cost per request. Panel two, decision quality: intake classification accuracy, policy violations prevented, human correction rate, escalation rate, approval override rate. Panel three, business outcome: cycle time from intake to request creation, touchless rate, request backlog, SLA compliance, rework per request. Panel four, governance and audit: top denied tool calls, approval queue aging, most frequently referenced policy documents, tool usage anomalies, trace samples for investigation. A dashboard like this serves three groups simultaneously: the engineering team sees runtime health, the process owner sees quality and outcomes, and risk and audit see compliance and the control trail.
Implementation Trade-offs: Don't Build a "Surveillance Monster"
Although observability is very important, there is another trap: organizations can overdo it and try to log everything without prioritization. The result is ballooning storage costs, dashboards full of noise, teams unable to identify the important signals, and increased privacy risk. Therefore, observability design must follow the risk tier and criticality of the use case. A use case like an internal knowledge assistant might be fine with lighter logging. Conversely, a use case like refund automation, finance exception handling, or IT remediation requires much deeper tracing and auditing. A healthy principle: log enough for accountability, measure enough for decision-making, and alert enough so that teams actually take action. Good observability isn't the one with the most data, but the one that best helps the company see, explain, and control agent behavior.
After reading this article, there are several decisions that should be made. First, define the end-to-end trace standard for every production agent. Can the company trace the flow from trigger to business outcome, including context retrieval, tool calls, policy decisions, approvals, and the final action? Second, separate metrics into three layers: technical, quality, and business. Who owns each layer, and what dashboard is used to read the relationships between them? Third, establish a logging policy for sensitive data. What can be stored raw, what must be redacted, who can access the logs, and how long is the retention period? Fourth, define alert categories. Has the company distinguished between technical incidents, policy breaches, low quality, and cost spikes, each with a different response path? Fifth, decide on the production quality review model. Will agent quality be monitored through automated evaluation, manual sampling, human feedback, or a combination of all?
There are several danger signs that observability is not yet ready to scale. The agent is allowed to act, but the company only stores basic chat logs. Tool calls are not connected to the same trace as the model's decisions. There is no way to explain what context the agent used when making a decision. All alerts go to a single channel without differentiation by priority or incident type. The team only monitors latency and uptime, but not correction rates or policy violations. The dashboard is only used by the technical team, not by process owners and risk functions. Logs are too rich in sensitive data without adequate redaction. There is no clear link between agent telemetry and business process KPIs.
A reflective question for CIOs, COOs, and transformation leaders: If your agent made a wrong decision tomorrow but didn't cause a technical error, would your organization find out quickly? Could you explain to an auditor or regulator how an agent action occurred from start to finish? Who currently owns the quality metrics for agents in production: engineering, business, or no one? Does your dashboard show business outcomes, or just infrastructure health? And most importantly: is your company truly ready to give agents greater autonomy before it is able to observe their behavior with discipline?
Observability is not an accessory after a system goes live. In the agentic enterprise, observability is the minimum requirement for keeping autonomy within the bounds of control.